By Chris Dunker, Lincoln Journal Star
Dec. 12, 2019
In a 5-4 decision earlier this year, the U.S. Supreme Court said determining if congressional or legislative districts had been gerrymandered along party lines was beyond the federal court's authority.
"None of the proposed 'tests' for evaluating partisan gerrymandering claims meets the need for a limited and precise standard that is judicially discernible and manageable," Chief Justice John Roberts wrote for the conservative majority.
But what are the tests, and the math underlying them, actually capable of showing?
Math in the City, a capstone class (MATH 435) at the University of Nebraska-Lincoln, spent the semester testing and retesting the battery of proposals that have been put forward as a measure of whether or not districts have been drawn fairly.
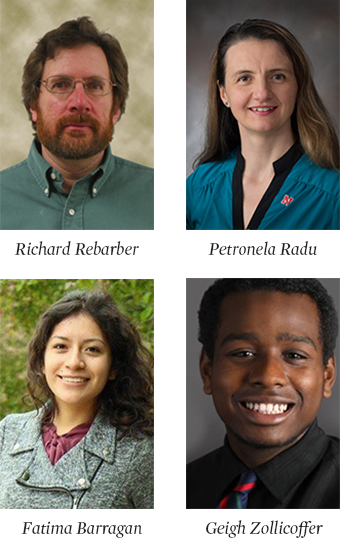
"The gist of the course is that gerrymandering can be measured, despite what the majority of the Supreme Court says," said Richard Rebarber, a professor of math at UNL. "But it's tricky, and there are reasons why the Supreme Court and some other courts have been careful."
Split into four teams and armed with past election data, algebraic expression and computer algorithms, the class evaluated four separate metrics and presented their findings at a mini-conference last week.
The first group focused on metrics to determine how geometrically compact and contiguous Nebraska's 49 legislative and three congressional districts were drawn in 2011, the last time the state went through redistricting.
According to their findings, the Polsby-Popper test — which assigns districts a value between 0 and 1 based upon a formula, with 1 being most compact, and which has previously been used in Nebraska — is best for determining compactness.
While District 42, representing North Platte and Lincoln County, earned a Polsby-Popper score of 0.77, District 27 representing west and southwest Lincoln had a score of just 0.24.
The students suggested if Sen. Anna Wishart's district was drawn to be more compact, docking the "tail" that extends southward and reclaiming area now represented by District 30, it could raise its score to 0.63.
But, the group concluded, a single test of how geometrically compact a district is by itself isn't a good indicator of how fairly its borders were drawn.
Other groups evaluated tests that have been deployed in other states, like the "votes-seats curve," which charts a correlation between the votes a party receives against the number of seats that party ultimately wins in an election.
A third measured the "efficiency gap," which compares the number of "wasted votes" per district -- the excess votes cast for a winning candidate above the threshold to win, as well as the total votes cast for the losing candidate -- against the total number of wasted votes cast statewide.
When the various wasted votes were weighted properly, the students said, the efficiency gap appeared to be a reliable measure of the fairness of a legislative or congressional district, as well as an accurate way to detect if electorates had been cracked or packed to dilute their voting power.
The last group to present their findings took a more theoretical approach to measuring gerrymandering: What would happen if you considered an actual redistricting plan against a representative sample of all possible redistricting plans?
Through a Markov Chain Monte Carlo method -- abbreviated MCMC -- the students concluded if an actual redistricting plan produced an outlier election result compared to the representative sample of all redistricting plans, there may be evidence of gerrymandering.
Simulating the outcomes of 10,000 elections based upon various alignments of nodes on a five-by-five grid, each outcome was recorded until the distribution of outcomes pointed to the likelihood of various results.
It's similar to the "probability-to-win tracker" displayed by ESPN during football games, said R.J. Riley, a senior math major from Omaha. In those events, he added, a computer simulates every possible outcome based on the current state of the game.
For an election, however, measuring all potential redistricting plan outcomes against the current redistricting plan in a state of 1,600 election precincts would require a vast amount of computing power and an undetermined amount of time to develop a representative sample size.
That's the biggest knock against the MCMC method, said Geigh Zollicoffer, a senior from Lincoln.
While the method removed politics from the equation, he said, "one of the only difficulties that people are researching now is how to speed it up."
Math in the City has taken a deep dive into other data-rich projects since the class was created in 2006.
The class has tracked the fall and rise of the housing market, pored over Husker football statistics and even looked for risk factors tied to heart disease in a partnership with the University of Nebraska Medical Center.
Petronela Radu, undergraduate chair of UNL's math department, said the class has also done a cost-benefit analysis on sustainable building construction, charted recycling routes and compared the spread of Lincoln's police stations to other cities when a new station was being considered.
"The course allows students to see how mathematics is used on a concrete, real-world problem of location and national interest," Radu said.
Riley said the course taught him to think about scale when addressing a problem using the math skills he's gained at UNL, a useful lesson he hopes will carry forward into the job market.
That's part of the lure of the class, Rebarber said. Instead of traditional math courses, where skills are taught and a list of problems is given as practice, Math in the City doesn't hold students' hands.
"Usually, we teach them a skill, we send them home with homework and they learn the skill," he said. "In this class, you have to figure out what skills you need to use."